



The Eswatini Land Health Dashboard is a web application that allows users to view and interact with the data collected in the Eswatini Land Health Project. The dashboard builds on the data reported here and is being co-developed within ESWADE - SMLP with funding provided by IFAD. It is designed to be used by a wide range of stakeholders, including policymakers, project managers, local land managers, agriculture and forestry frontline staff and scientists.
The results were obtained through the adoption of the Land Degradation and Surveillance Framework (LDSF). The LDSF provides a holistic assessment of ecosystem health at the landscape level by sampling a wide range of biophisical indicators. Combined with satellite data, this provides an accurate monitoring framework to track ecosystem health and land degradation.
Department of Land Use Planning and Development
Tel: (+268) 2404 3858
Fax: (+268) 2404 3858




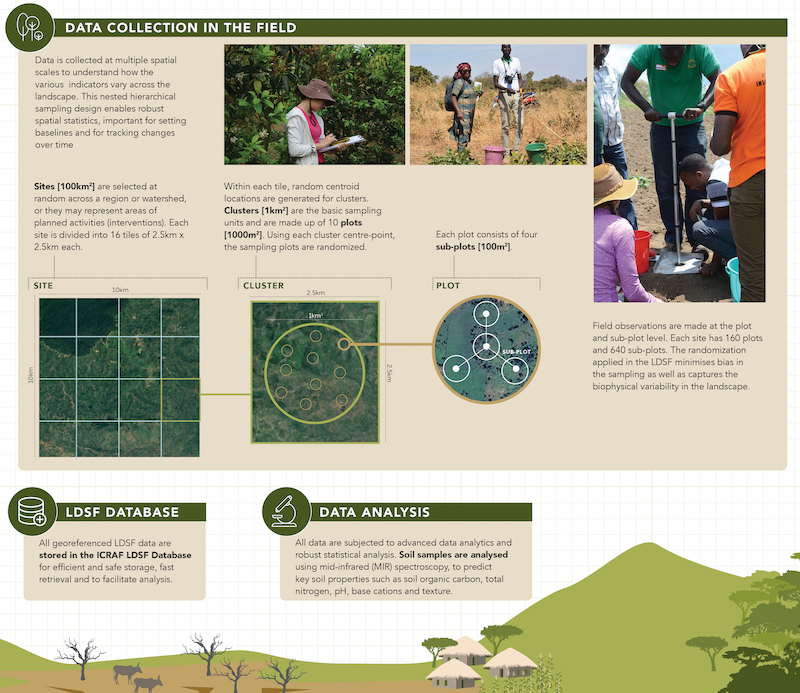
The LDSF is a comprehensive method for assessing soil and land health, from the field to the use of new and advanced data analytics. It provides a consistent set of indicators and field protocols to assess the “health” of an ecosystem. This includes vegetation cover and structure, tree, shrub and grass species diversity, current and historic land use, infiltration capacity, soil characteristics and land degradation status.
For the ESWADE project, the LDSF was used to survey throughout Eswatini at twelve sites. Based on these sites, tree and shrub prevalence, vegetation structure and soil health indicators were assesed for the whole country. The soil health indicators are derived from the soil samples and include indcators such as soil oragnic carbon, sand and clay content, pH levels, nitrogen, calcium and more.
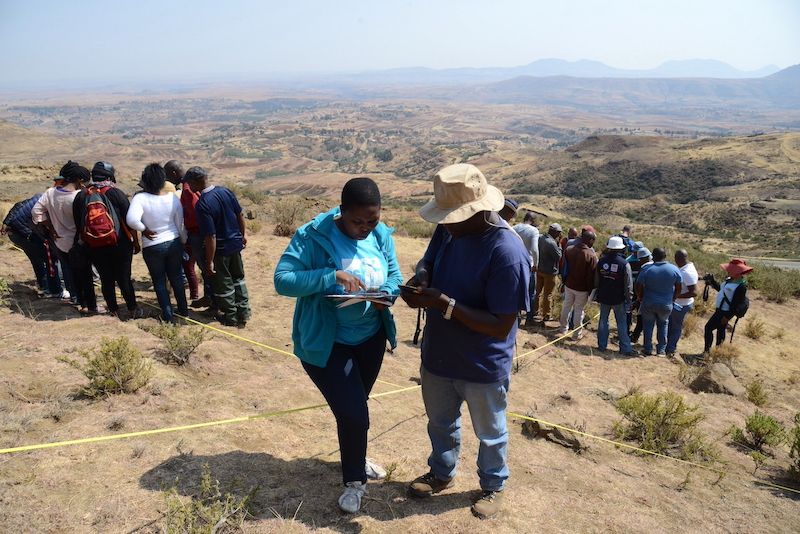
LDSF workshop in the field
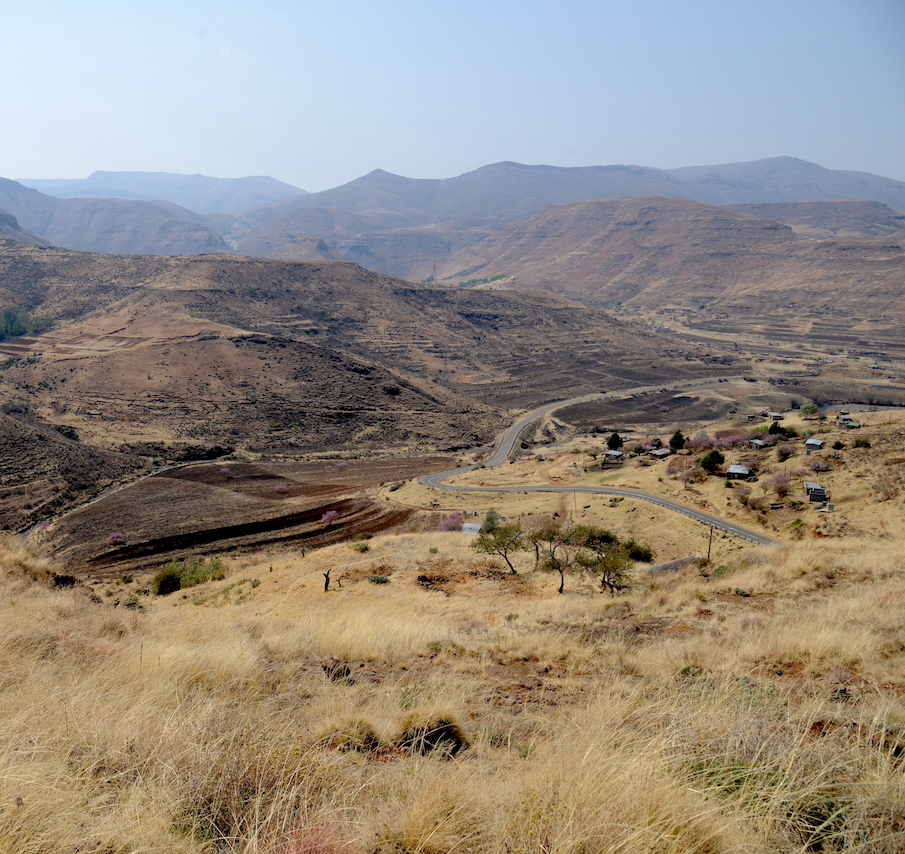
The LDSF sites surveyed ranged in elevation from about 190 m at Sithobela site to over 1350 m at the site in Mhlambanyatsi. The sites were spread out over Eswatini allowing to assess the ecosystem health for the whole country. On the interactive map you can see that the twelve sites are devided into sixteen clusters which are, in turn, made up of ten plots (red dots). This means that each site consists of 160 (16 * 10) sampling points where soil samples are taken and a detailed vegetation inventory is performed.
The LDSF sites cover a wide range of vegetation structure types and ecosystems, as summarized in the graph below. Bushlands and croplands represent the most common vegetation types in Eswatini, followed by wooded grasslands and grasslands. The least common vegetation types are mangroves and thickets. Additionally, trees and shrubs were found at approximately half of the sampling locations. Lastly, the graph show a very low vegetation cover at all sites. Notably, the site with the highest cover had only 14% vegetation cover!
Severe erosion was seen at the majority of the sites. The low vegetation cover is likely part of the cause of these high erosion rates. At ten out of the twelve sites, severe erosion was present at 70-90% of the sampling locations. Only at Mhlambanyatsi site, erosion was considerably lower with 55% of its plots experiencing no erosion at all.
In total, 133 tree species and 92 shrubs species have been identified. Wooded vegetation higher than 3 meter was identified as a tree while smaller than 3 meter was counted as a shrub. The most common tree species recorded were Dichrostachys cinerea, Vachellia nilotica and Spirostachys africana. For shrubs the most common species were Lantana camara, Dichrostachys cinerea and Vachellia nilotica.
The graphs below show a summary of the variations in soil organic carbon (SOC), sand content, clay content and soil pH for each of the twelve LDSF sites. The violin plots show the distribution of each of the soil properties as well as the median value (grey line). We can see high overall SOC in Mhlambanyatsi with a wide distribution, or a lot of variability. Namisa, on the other hand, has low SOC and low variability indicated by the truncated shape of the violin. In other words, Namisa is more constrained in terms of soil health than Mhlambanyatsi.
Soil properties often occur in complex and dynamic compositions. Generally, clay soils contain high carbon (SOC) concentrations which suggests a positive relation between clay contents and SOC. Sandy soils, on the other hand, tend to contain little SOC, suggesting a negative relation. Furthermore, soil nitrogen can increase plant productivity and, therefore, positively affect SOC levels.
There are many more ways in which soil properties interact with each other. Explore these relations yourself in the plot!
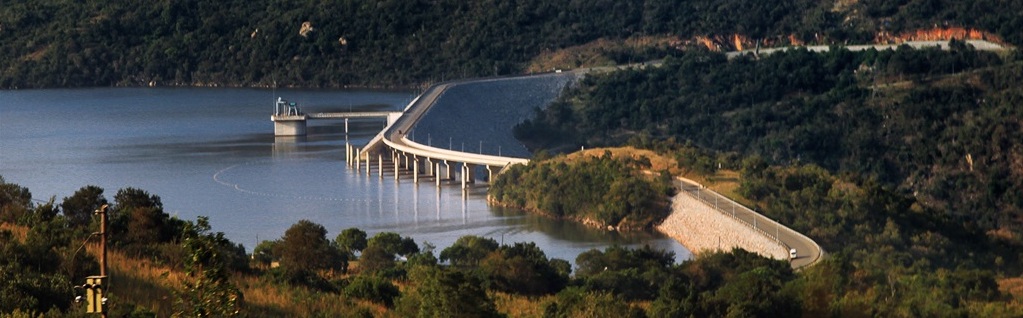
Hydrology and topography are interrelated. Topography shapes the movement and distribution of water across landscapes as elevation and slope determine water flow, drainage patterns, runoff, and infiltration. Watersheds can be assessed at various levels. At level 1, a watershed can conver multiple countries, while at higher levels, a watershed can be as small as a few km^2. Also, hydrology significantly impacts ecosystem health. It regulates water availability, sustains diverse habitats for wildlife, and influences water quality by managing pollutants and nutrients. Moreover, hydrological processes support essential ecosystem functions like nutrient cycling and energy flow.
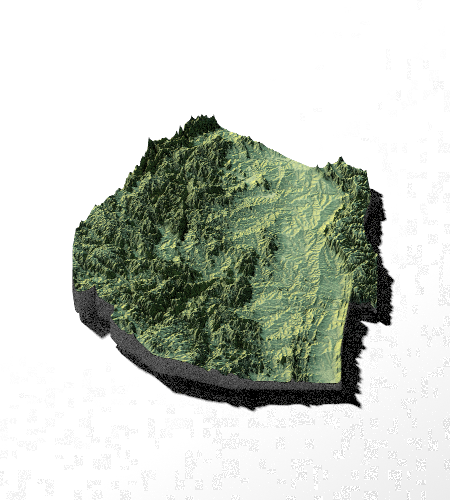
Forests play a pivotal role in ecosystems by fostering biodiversity, regulating water cycles, and absorbing carbon dioxide. Through photosynthesis, trees absorb CO2, releasing oxygen, and, thereby, provide a large service to people. Additionally, forests provide habitats for many species and aid in regulating temperatures. Therefore, preserving forests is crucial for sustaining biodiversity and curbing climate change.
Below there are tree and forest cover maps of Eswatini based the LDSF data and satellite images. Note: tree cover does not equal forest cover.
On this page you can find an overview of the livestock in Eswatini. The livestock is split up in bulls, beef cows, dairy cows, goats and sheep. Explore the presence of livestock in the various regions in Eswatini or have a look at the precense of livestock at the Inkhundla level.